Have you ever come across an old system which doesn’t scale nor performs as well as it should (or expected). The system has perhaps grown organically and nobody owns the end to end architecture. Sounds familiar? This first part of optimization is about defining performance.
#Introduction [2019-10-08] Disclaimer: This is a draft
Every now and then you are faced with performance issues. This could be a single function or system level performance. A lot of developers has a gut feel that a rewrite will solve everything. First off - I don’t think a rewrite is the right path for performance issues and very seldom the right path regardless. Rewrite can be a topic if the techinical debt is so high that a platform change is required - but it is very rare a rewrite is the cure for performance issues.
#Why Performance User experience. Better user experience means happy customers which means more revenue. So essentially, it’s a business critical feature. Poor performance leads to unhappy users and lost customers. A lot have been written on this topic, here are some links discussing performance.
https://developers.google.com/web/fundamentals/performance/why-performance-matters
http://designingforperformance.com/performance-is-ux/
#Defining performance One of the key aspects to performance is to define what it is and to set performance goals. Without it there is actually a big risk you simply won’t know if you have an improvement and if the improvement has business impact. A lot of research has been made to measure user irritation levels due to response time - use it! Besides that you need classify various operations and set target levels. Example (classification of requests):
- Simple request/reponse (fetching a single object from the database), < 1 sec
- Medium request/reponse (involving several tables, db request, joins and some business logic), 1-2 sec
- Complex request/reponse (generating report), 5-10 sec
Obvious the above is very coarse but it serves as an example. You have to go through your functions and define your expected levels.
#Finding bottlenecks and problems There are several places you can find bottlencks, some examples are:
- Initial loading performance
- Many small resources fetched from the server?
- Big scripts not required in the beginning?
- Slow I/O
- You are fetching data from somewhere else
- Not using asynchronous I/O
- Database
- Many small requests
- Domain model vs data model mismatchs
- Not properly indexed
All of these are places where bottlenecks are likely to show up - there are many more, but this just an example of the most common ones. Make sure you tackle them, like; baking similar resources togehter. Bundling and minimizing scripts. Use async I/O when possible. Split large JS files and lazy load them. Place DB indexes and keys properly, check if you can merge many small requests.
An example of large scripts bundles. If your page has a login only the login workflow will be active during authentication. Make sure your authentication JS bundle does not contain the rest of the application. Fetch that part once authentication is complete. This also adds some security as you won’t expose your backend API to unauthenticated users.
#Environment Regardless of your server choice you should at least try to fix:
- Enough RAM, there is no excuse - it’s cheap
- Don’t use the server/instance for anything else - use isolation
- Use SSD disks wherever possible
- Avoid any energy saving settings
- Likely pattern: Slow initial request subsequent fast
- Try to deny the OS swapping out your application during idle time
#Measuring performance If you don’t have it - add a simple server middle-ware that logs every request and the server response time (from begin/end). This will give you a techincal map of what functions are most used and which functions consume the most time. When you have the map you ask stakeholders to add their weights (business value, roi, cost, etc..) to help you build a hitlist.
Your performance data should include at least:
- Timestamp, when it happened
- URL, the full url
- Duration, the time it took to execute
Additionally I would add:
- Domain, which business domain
- API function, which exact function was hit
- User Agent
- Localization, which localization was used for the request
Most important is of course Duration and URL. I usually compute the duration as seconds representing it with floating point value. Some pseudo-code for the measurement would perhaps look like:
    double tStartInSeconds = Now();
    FunctionToBeMeasured();
    double tDurationSec = Now() - tStartInSeconds();
    PerformanceLog.Write(DateTime(), URL, "FunctionToBeMeasured", tDurationSec, "TheDomain",request.UserAgent, request.URL);
Normally you can hook this into your web-service framework as a middle ware function, like:
    /// in you API setup, note this will different depending on your framework
    RequestHandler.AddHandler(PerfMiddleWare);
    /// somewhere further down
    void PerfMiddleWare(Handler next, Request request, Response response) {
        double tStartInSeconds = Now();
        Next();
        double tDurationSec = Now() - tStartInSeconds();
        PerformanceLog.Write(DateTime(), URL, "FunctionToBeMeasured", tDurationSec, "TheDomain",request.UserAgent, request.URL);
    }
#Where/When to measure You need several types of measurements, under various conditions. For example:
- Ideal conditions, single user - no server load
- Medium conditions, with an average load on the server
- Extreme conditions, with high load on the server
Besides this you need a few measurements per function to get your averages in order. Depending on your environment there are several tools out there to generate load. Use them! There are also databases you can use to store your load-reports in.
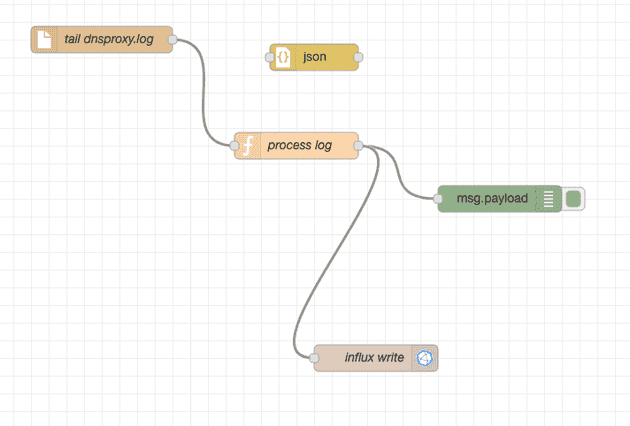
##My setup The setup I am usually running for smaller projects just reuses basic open source tools. My server code spits out a line of performance data to a stream. In simple cases I link this stream to a file which I consume with tail reader in Node-RED (https://nodered.org/), which is then transformed and written to InfluxDB. The transformation is just a data type transformation and some InfluxDB (https://www.influxdata.com) specific things which in order to tag data properly and then presenting the data with help of Grafana (https://grafana.com/).
- server -> performance file
- Node RED
- tail reader (performance file) -> transform
- transform -> InfluxDB
- Grafana
The output from the server is one json object per request, making it easy to consume for further processing.
{
   "@timestamp":"2019-06-06T13:35:21Z",
   "@version":"1",
   "Fields":{
      "useragent":"Mozilla/5.0 (iPhone; CPU iPhone OS 12_2 like Mac OS X) AppleWebKit/605.1.15 (KHTML, like Gecko) Version/12.1 Mobile/15E148 Safari/604.1",
      "requesturi":"/api/v1/resource/getLocalizationData/en",
      "host":"192.168.1.8:3050",
      "version":"v1",
      "domain":"resource",
      "api":"getLocalizationData",
      "method":"GET",
      "statusCode":200,
      "handlermethod":"domain.com/api.getLocalizationDataHandler",
      "handlererror":"",
      "timesec":0.002262491
   }
}
The Node-RED flow is very simple:

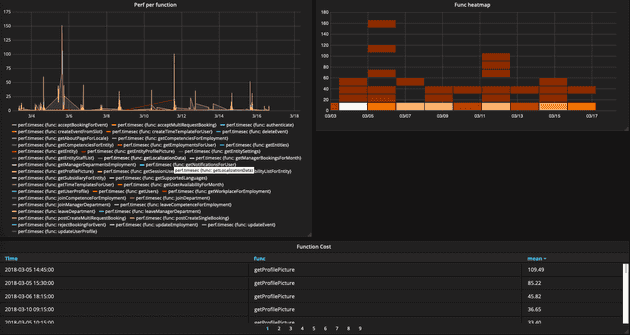
One of the dashboards in grafana shows the function cost, it looks like:

Interestingly enough the one function which has the highest server latency is the getProfilePicture function. This is interesting because it just serves a file based on a user-id. Turns out that the energy saving on this particular server would put the harddrive to sleep quite fast and thus every now and then causing very long response time for the server. This is what I would call a false indicator - my software was actually working but the environment was not trimmed.